
Urocytology
Image Cytometry
Explanations
& Definitions
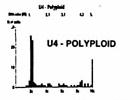
| HISTOGRAM
CLASSIFICATION
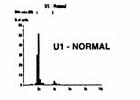
The classification
of cells by five types of histograms is the simplest and most generally
accepted method in current use at M.D. Anderson Cancer Center.
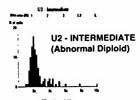
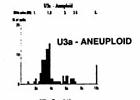
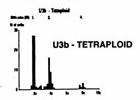
*: U2 intermediate patterns have a strong positive prediction for presence of histologically confirmed or cystoscopically visualized neoplasm(s). In a few cases, the underlying neoplasm may be initially occult. However, it will manifest itself over a sufficiently long follow-up time.) Occasionally this pattern may be seen with lithiasis (stones), therapy effect, or in specimens containing seminal vesicle cells; hence, clinical correlation is essential. **: U3a clearly shows aneuploid pattern(s). Sensitivity (>90%) for carcinoma in situ and invasive TCCs (or its variants). ***: U3b shows tetraploid pattern slightly less sensitive than U3a for predicting the presence of neoplasm. |
||||||||||||