
| Our Service | |
| Image Cytometry Analysis | |
| General Image Cytometry | |
| Lymphoproliferative Disorder Image Cytometry | |
| Urocytology Image Cytometry | |
| Cyclin D1 FISH test | |
| Fluorescence in situ Hybridization (FISH)Images | |
| Immunohistochemistry Analysis Images | |
| t1114 Fusion FISH | |
| UroVysion FISH | |
| Contact Us |

Fluorescence in situ Hybridization (FISH)
 |
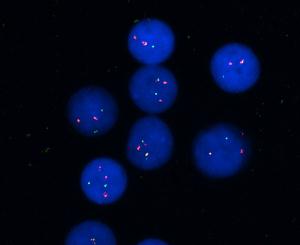 |
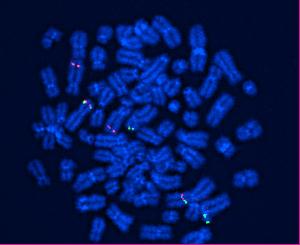
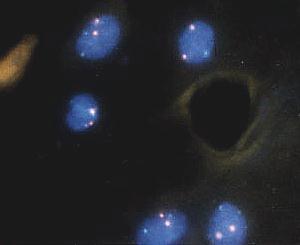
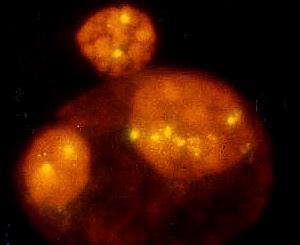
| Fig.1. ALK probe from Vysis on a t(2;5)(p23;q35) positive cell line metaphase show 2p23 rearrangement. (spliced green and orange signals). | Fig.2. t(11;14)(q13;q32) detected by using Vysis's CCND1/IgH fusion probe on a Mantle Cell Lymphoma sample.(orange: CCND1 on 11q13; Green:IgH on 14q32) |
 |
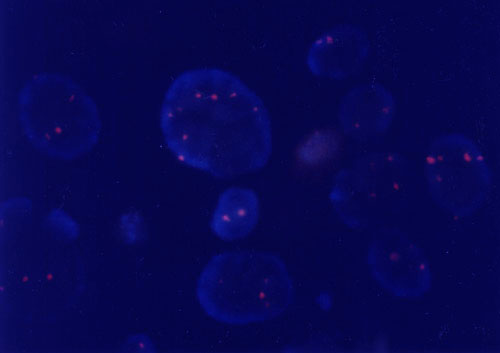 |
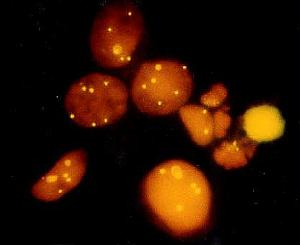
| Fig.3. Chromosome 8 Centromere Probe interphase FISH (From a high grade TCC patient). | Fig.4. Chromosome 9 Centromere Probe interphase FISH. |
 |
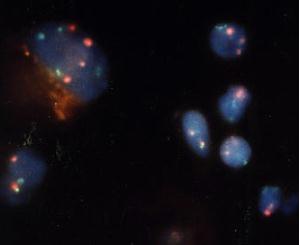 |
| Fig.5. Chromosome 10 and 17 two color interphase FISH From a TCC patient.(Orange: chromosome 17, Green: chromosome 10). | Fig.6. Chromosome 12 and 17 two color interphase FISH (From a low grade TCC patient). |
 |
 |
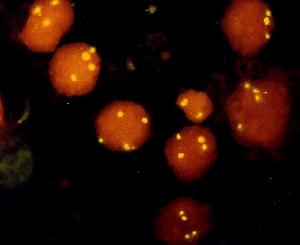
| Fig.7. Chromosome 12 centromere probe interphase FISH. | Fig.8. Chromosome 12 centromere probe interphase FISH. |