
Lymphoproliferative
Disorder
Image
Cytometry
Explanations
& Definitions
| HISTOGRAM
CLASSIFICATION
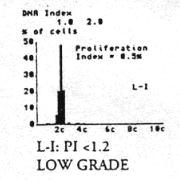
The classification of cells by 6 types of histograms is
the simplest and most generally accepted method in current use at M. D.
Anderson Cancer Center.
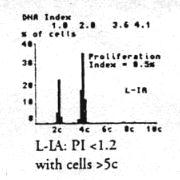
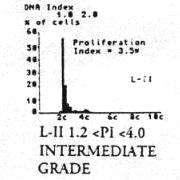
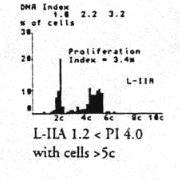
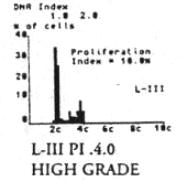
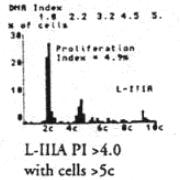
Note: L-I, L-II, L-III subdivided by proliferation
index: I < 1.2; II < 4.0; III > 4.0. L-IA, L-IIA, L-IIIA are as above
but with hyperdiploid cells (DNA content > 5c).
Relationship between Histogram
Patterns and Grade of Non-Hodgkin's Lymphoma and Reactive Lymph Nodes
Reference: Katz RL, Wojcik EM, Johnston DA:
Image analysis in non-Hodgkin's lymphomas emphasizing applications in tissue
procured by fine needle aspiration. In: GL Wied. ed. Compendium on the
Computerized Cytology and Histology Laboratory, Science Printers and Publishers,
Inc., St. Louis, MO, 1993.
|
||||||||||||||||||||||||||||||||||||||||||||||||||||||||||||||||||||||||||||||||||||||||||||||||||||||||||||||||||||||||||