 |
 |
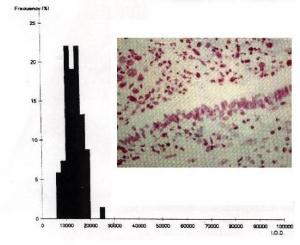
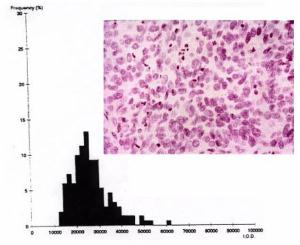
| Fig.(1a) DNA histogram shows a single diploid
population from normal bronchial epithelium (1b) adjacent to squamous carcinoma
in a patient who survived for less than 24 months or a progressor (Feulgen
stain x 400). |
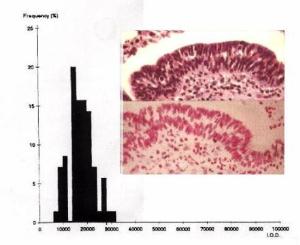
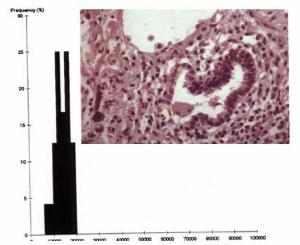
Fig.(2a) Same patient as figure (1) DNA histogram
shows a predominantly diploid pattern but with a broader coefficient of
variation compared to fig.1a measured from (2b) Feulgen stained slide of
bronchial hyperplasia adjacent to lung cancer (Feulgen x 400) Fig. (2c)
shows the same area as (2b) (H&E x 400). |
 |
 |
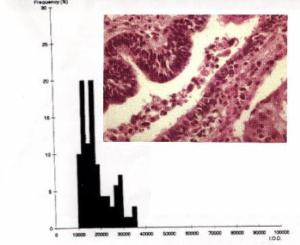
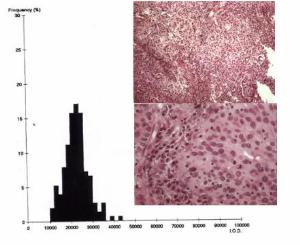
| Fig.(3a) DNA histogram measured from bronchus
in same slide as fig 1 and 2, (fig 3b) showing focal areas of dysplasia
adjacent to the carcinoma (H&E x 400), shows emergence of a small aneuploid
sub-population. |
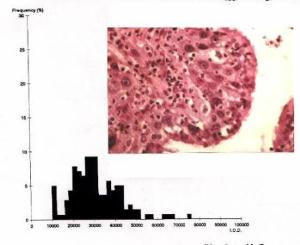
Fig.(4a) DNA histogram from poorly differentiated
squamous carcinoma with bronchial wall invasion as shown in fig 4b (H&E
x 400) from same patient as fig 1-3, show multiple aneuploid stem-lines
with major peaks around 3C and 4C, with many cells with DNA content > 5C. |
 |
 |
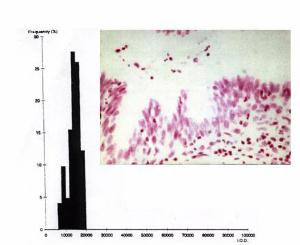
| Fig.(5a) DNA histogram shows a single major
diploid peak in cells measured interactively from (b) normal bronchial
mucosa adjacent to the carcinoma (Feulgen x 100) in a progressor or patient
who survived less than 24 months with squamous carcinoma. |
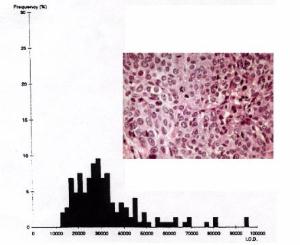
Fig.(6a) Poorly differentiated squamous carcinoma
same patient as fig. (5) note mitotic figures, (H&E x 400). Fig. (6b)
DNA histogram showed multiple aneuploid stem lines with numerous cells
with DNA content > 5C. |
 |
 |
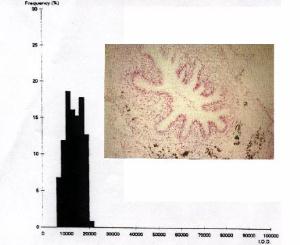
| Fig.(7a) DNA histogram from normal bronchus
(fig7b) in a patient with squamous carcinoma (fig 8) who survived >24 months,
shows a diploid population centered between 10000-20000 AU. |
Fig.(8a) DNA histogram from a long survivor
with squamous carcinoma as depicted in fig 8b (Feulgen stain x 400) shows
a predominantly diploid DNA population with rare cells with DNA content
> 5C. |
 |
 |
| Fig. (9a) Diploid DNA histogram with main
peak between 10000-20000 arbitrary units (AU) measured from fig 9b. Normal
bronchial epithelium adjacent to tumor in non-progressor with squamous
carcinoma (H&E x 400). |
Fig.(10a) Squamous carcinoma from long term
survivor > 24 months, same patient fig 9, (H&E x 100). Fig.(10b) Higher
magnification of well to moderately differentiated squamous carcinoma (H&E
x 400). Fig. (10c) DNA histogram shows a predominantly diploid sub-population
with 0% cells with DNA content > 5C, from same patient as fig. 9a,b, Fig10a-b.
who survived for longer than 24 months with stage I lung cancer. |
 |
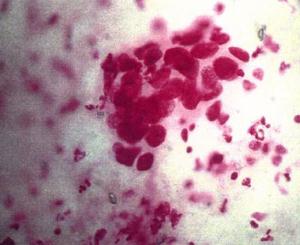 |
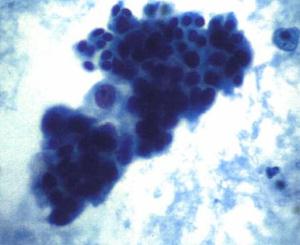
| Fig. (11a) FNA of non-small cell lung carcinoma
with features of adenocarcinoma in a patient with concurrent brain metastases
(Papanicoulau x 400). |
Fig. (11b) Feulgen stain performed on a destained
Pap smear of fig.11a. (Feulgen x 400). |
 |
 |
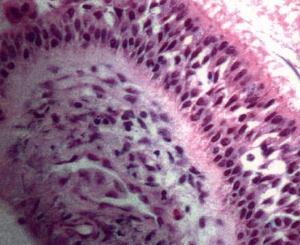
| Fig. (11c) Normal bronchus in cell block
prepared from the FNA depicted in fig.11a. (H&E x 400). |
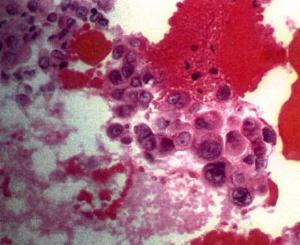
Fig. (11d) Cell block prepared from same
FNA showing malignant cells of adenocarcinoma prepared from FNA depicted
in fig 11a. (H&E x 400). |