
|
|

General
Image Cytometry
| HISTOGRAM
CLASSIFICATION
The classification
of cells by five types of histograms is the simplest and most generally
accepted method in current use at M.D. Anderson Cancer Center.
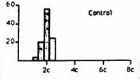 |
Control:
Characterized
by a single DNA content peak in the diploid (2c) region. |
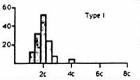 |
Type I :
These
histograms are characterized by a single DNA content peak in the diploid
(2c) region. Only a few cells may deviate from this normal value. |
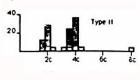 |
Type II:
This type of histogram is characterized either by one peak in the tetraploid
region, or by two peaks, one in the 2c and one in the 4c region. Few, if
any, cells will have a DNA content between 2c and 4c, which corresponds
to the normal DNA synthesis phase. Only a few cells may be found outside
the normal DNA content values; these cells generally have a DNA content
in the 8c region. |
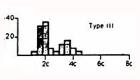 |
Type III :
This
type of histogram differs from Type II by having a significant number of
cells with DNA content value between 2c and 4c. The proportion of these
cells, considered as S cells, is used to evaluate the proliferation activity
of the cell population. |
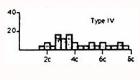 |
Type IV :
These
histograms reveal a pronounced and irregular aneuploidy with DNA content
values between 2c and 6c, or even 8c and more.. |
Significance: In
general, patients with Type I and II histograms have an improved survival
rate over patients with Type III and IV histograms. However, in a small
number of patients, Auer histogram type may not always be predictive of
outcome, (Auer-et al. ANALYTICAL AND QUANTITATIVE CYTOLOGY, 161-165,
1980.)
-
Coefficient
of Variation (CV) is
the standard deviation expressed as a percentage of the mean.
-
DNA
Index is
the ratio of sample G1 DNA value to the diploid value of the external reference
cells.
-
Ploidy
Balance (PB) is
the percentage of cells in classes 2c, 4c, and 8c less the percentage of
cells in other classes.
-
Hyperploidy
Degree (DH) or Rare Event Analysis is
the percentage of cells having DNA content greater than 5c.
-
Proliferation
Index (PI) is the percentage of cells outside the major peaks
(MP), not including adjacent peaks. The PI is lower than the S-phase
as measured by Flow Cytometry, but is proportional to it.
PLOIDY
-
Diploid:
Histogram
whose principal peak is centered at 2c.
-
Aneuploid:
Histogram
whose principal peak is not centered at 2c.
-
Tetraploid:
Histogram
whose principal peak is centered at 4c.
-
Heteroploid:
Histogram
of cell lines having different ploidy.
-
Hyperploid:
Histogram
showing cells having a DNA content greater than 5c.
-
Hypoploid:
Histogram
showing cells having a DNA content less than 2c.
Note:
A
sample can present several of these characteristics simultaneously.
ANTIGEN
QUANTITATION
-
Labeling
Index:
In the case
of nuclear immuno-enzymatic labeling, this index is equal to the ratio:
- number of labeled cells/total number of cells
In the case
of cytoplasmic immuno-enzymatic labeling, this index is equal to the ratio:
- area of labeled protions/total area of the structures
-
Mean
Optical Density:
This index
is equivalent to mean labeling concentration; this is the mean of optical
densities measured over:
- the
labeled nuclei in the case of nuclear immuno-enzymatic labeling
- the
labeled areas within the structures in the case of cytoplasmic immuno-enzymatic
labeling
-
Quick
Score:
This index
is equal to: labeling index (LI) (x) mean concentration/100
-
Low:
(LI)=<5%,Intermediate:
(LI)=6-14%, High: (LI)=>15%
For breast
cancer in node-negative patients, Ki-67 (LI)>15% has an increased likelihood
for relapse or shorter disease free survival. (LI)<5% reflects a low
likelihood for relapse. (Reference: Ki-67 Immunostaining in Node-Negative
Stage I/II Breast Carcinoma. Aysegul A. Sahin, M. D., et al., Cancer, Vol
68, No. 3 August 1, 1991.)
|
|